-
NWEA MAP Test Scores: What’s New for Math, Reading, Science & Language in 2026–2
If you’ve ever opened your child’s MAP Growth report and felt more confused than informed, you’re not alone. NWEA MAP scores can provide a detailed picture of a student’s current achievement and academic growth in math, reading, language usage, and science—but only when you know how to interpret the numbers.
MAP Growth is a computer-adaptive assessment. Instead of giving every student exactly the same set of questions, the test adjusts the difficulty based on the student’s responses. This allows the assessment to identify what a student already knows and where additional instruction may be needed. NWEA says MAP Growth is used across grades K–12, with subject availability varying by grade.
For the 2026–2027 school year, the 2025 MAP Growth norms are the important national reference point. NWEA updated its norms to account for changes in U.S. student demographics, post-pandemic academic performance, and changes to the MAP Growth item-selection algorithm. The RIT scale itself remains stable, but the national comparison data used to interpret achievement and growth has been updated.
What Does an NWEA MAP Score Actually Mean?
MAP Growth results are reported using a RIT score, which represents a student’s achievement on a stable vertical scale. Because the RIT scale is designed to remain consistent across testing occasions, schools can use it to monitor academic growth over time rather than looking only at whether a student passed or failed a particular test.
A RIT score by itself, however, doesn’t tell the entire story. Parents should consider the score alongside:
Grade level
Subject
Testing season
National achievement norms
Achievement percentile
Growth percentile
Previous MAP scores
Expected or projected growth
For example, a 200 RIT score means something different depending on the student’s grade and subject. The same number should not be interpreted as a universal “good” or “bad” MAP score.
The achievement percentile is another important part of the report. It compares a student’s performance with students in the same grade nationally. A percentile of 72 means the student’s achievement was higher than that of approximately 72% of the comparison group. Growth percentile is different: it focuses on how much a student has progressed compared with students who had similar starting performance.
NWEA’s Family Report presents achievement and growth together, helping families see both where a student is performing and how that performance has changed over time.
What’s New for MAP Scores in 2026–2027?
The biggest change parents should know about is not a new RIT scale. Instead, NWEA has introduced updated 2025 norms that provide a newer national reference for interpreting MAP Growth results.
The 2025 norms replaced the previous 2020 norms and were developed using a very large national dataset. NWEA explains that the update reflects changes in student demographics, post-pandemic achievement patterns, and improvements to the MAP Growth assessment.
This means an older MAP score chart found online may not give the same percentile interpretation as a current chart based on the 2025 norms.
Importantly, the changes are not identical across every subject, grade, or achievement level. NWEA reports that reading and language usage show some of the more noticeable changes, while science is comparatively stable. Mathematics also shows variation depending on achievement level.
So, for 2026–2027, parents should avoid comparing a current MAP report with an outdated score chart without checking which norms the chart uses.
NWEA MAP Math Scores in 2026–2027
Math is one of the core MAP Growth subjects and is available from kindergarten through Grade 12, including specialized course-specific assessments for subjects such as Algebra and Geometry.
A student’s math RIT score can be used to track progress from one testing period to another. Instead of asking only whether the student is “at grade level,” MAP Growth can help identify whether the student’s mathematical achievement is increasing, staying relatively stable, or falling behind expected growth.
When reviewing a 2026–2027 math score, look at the student’s:
Current RIT score
Previous RIT score
Achievement percentile
Growth percentile
Grade-level national comparison
Testing season
The 2025 norms are particularly important when comparing a current math percentile with older MAP reports because the national reference points have changed.
NWEA MAP Reading Scores in 2026–2027
Reading is another major MAP Growth assessment area. NWEA offers reading assessments across K–12, including MAP Growth K–2 for younger learners. The early-grade assessment is designed with younger readers in mind and can include audio support.
Reading MAP scores can help teachers and parents understand a student’s achievement and growth in areas connected to reading development. Because reading performance has shifted in different ways across achievement levels, the 2025 norms are especially relevant when interpreting current percentiles.
A student who receives the same RIT score as a student from several years ago may not necessarily receive the same percentile ranking. That is one reason current 2025-norm charts are preferable for interpreting 2026–2027 results.
NWEA MAP Science Scores in 2026–2027
MAP Growth Science is available for Grades 2–12. NWEA describes the assessment as covering three broad science areas: life sciences, earth and space sciences, and physical sciences.
Science is slightly different from math and reading because it begins at Grade 2 rather than kindergarten. When evaluating a science MAP score, families should again consider the grade, testing season, RIT score, percentile, and previous results.
According to NWEA’s explanation of the 2025 norms, science has generally shown less dramatic norm changes than some other subjects. That does not mean the old and new charts should be mixed, however. A current 2025-norm reference remains the appropriate comparison for 2026–2027 results.
NWEA MAP Language Usage Scores in 2026–2027
Language Usage is another MAP Growth subject and is generally available for Grades 2–12. It provides information that can complement reading results by giving educators another view of a student’s language-related academic development.
The 2025 norms are particularly worth paying attention to for language usage because NWEA identified meaningful changes in achievement and growth patterns at some performance levels.
When looking at a language usage MAP score, don’t focus only on whether the RIT number appears high or low. Compare it with the student’s previous results and the appropriate national percentile for the student’s grade and testing season.
Why Fall, Winter and Spring Scores Are Different
MAP Growth is commonly administered during multiple periods of the school year. Many schools test students in the fall, winter, and spring, although exact testing schedules can vary by school or district.
A fall score should therefore not be compared directly with a spring score without considering the testing season.
For example, a student might have:
Fall: 205 RIT
Winter: 211 RIT
Spring: 218 RIT
The important information isn’t simply that the final number is 218. The sequence shows how the student’s achievement changed throughout the year.
This is one of the main advantages of MAP Growth: the stable RIT scale allows schools to follow performance over multiple testing events.
Are Old MAP Score Charts Still Accurate?
They may still show the correct RIT scale, but they can be misleading if they use older national norms.
The 2025 MAP Growth norms are now the current reference for national comparisons. NWEA specifically says the RIT scale stayed the same while the norms were updated.
That’s an important distinction:
The student’s RIT score did not change because of the new norms. The way that score is compared with the national population can change.
For parents researching MAP scores for 2026–2027, this means it is worth checking whether a score chart is based on the 2025 norms before using it to decide whether a score is average, above average, or below average.
How to Read Your Child’s MAP Growth Report
A simple way to read a MAP report is to work through the information in this order:
Identify the subject. Math, reading, science, and language usage have different score distributions.
Check the grade. National comparisons depend on grade level.
Check the testing season. Fall, winter, and spring scores should be interpreted within their appropriate testing windows.
Look at the RIT score. This shows the student’s achievement on the MAP Growth scale.
Check the achievement percentile. This provides national context.
Look at growth. Compare the student’s current performance with previous testing results.
Consider instructional information. A score is most useful when it helps identify what the student should learn next.
NWEA emphasizes that MAP Growth scores are only one piece of information teachers use when evaluating student performance. Families should consider the complete report and discuss questions about individual performance with the student’s teacher.
Quick Guide to MAP Growth Subjects for 2026–2027
For the current MAP Growth assessment structure, the main subject coverage is:
Math: K–12
Reading: K–12
Language Usage: Grades 2–12
Science: Grades 2–12
NWEA also offers MAP Growth K–2 assessments for early learners and Spanish-language MAP Growth options for certain subjects and grade levels.
The Bottom Line for 2026–2027 MAP Scores
The most important thing to remember about NWEA MAP scores in 2026–2027 is that the RIT scale remains stable, but the national reference has been updated.
The 2025 MAP Growth norms provide the current context for interpreting achievement and growth. They reflect newer student data, post-pandemic academic patterns, demographic changes, and updates to the assessment’s item-selection approach.
Whether you’re looking at math, reading, science, or language usage, don’t judge a MAP score by the RIT number alone. The most meaningful interpretation comes from looking at the RIT score + grade + season + percentile + growth over time.
For families researching MAP scores during the 2026–2027 school year, using current 2025-norm references can make it much easier to understand where a student’s performance stands and how much progress they are making.
-
This discussion was modified 1 month ago by
 jimmy james.
readyscores.com
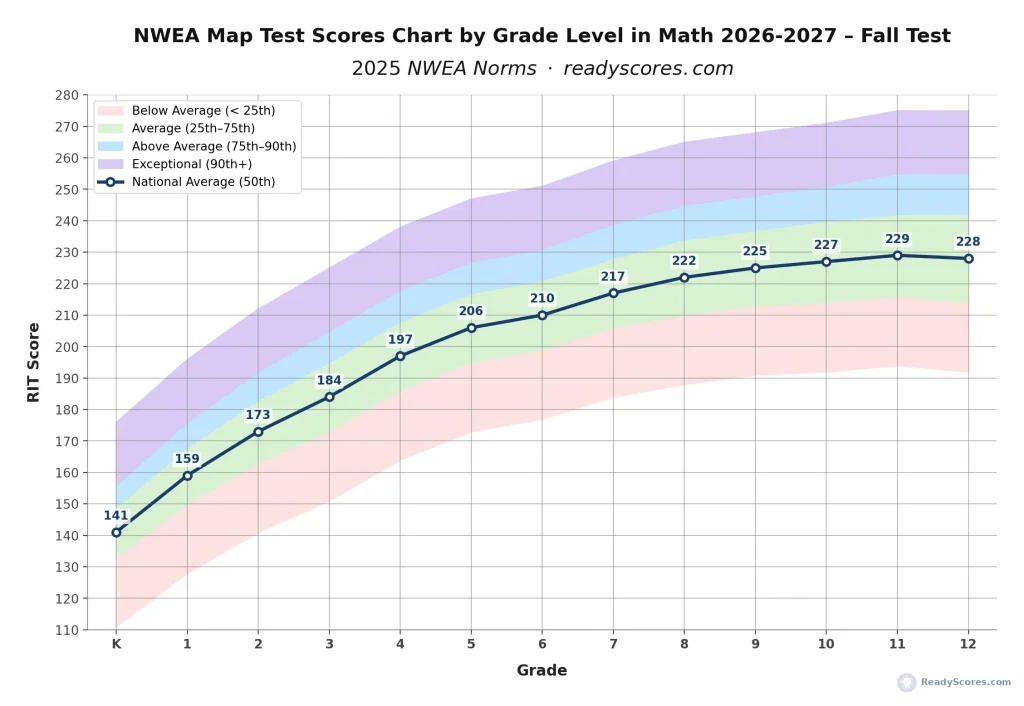
NWEA Map Test Scores Chart by Grade Level Math 2026-2027 (Quick Lookup)
NWEA Map scores chart by grade level in Math for 2026-2027 (Quick Lookup) and quick easy chart table reference to find out what is a good Map score in Math
-
This discussion was modified 1 month ago by